


Daily Technical Analysis: US Dollar Rises Against the Euro and Sterling Pound, EURUSD Nears Major Support

EURUSD 1H chart shows downtrend accelerating in recent sessions since the beginning of the week. Price is below short term moving averages (5, 10, 30), showing short-term selling pressure.
Immediate support is 1.1288. Breaking below this level might indicate further downside momentum towards support levels 1.1250 and1.1220. It’s important to note dynamic resistance levels presented by the moving averages noted above. These levels are currently at 1.1325–1.1350. If candlestick patterns show reversal near those levels, downward movement is expected.
RSI has entered oversold territory below 30 level, but with no clear bullish divergence for reversal yet.
The overall bias is Bearish. A short-term pullback could occur, but as long as price remains below 1.1350, sellers are in control. Watch for rejection signals at the 10- or 30-MA levels.
EURUSD 1H Chart
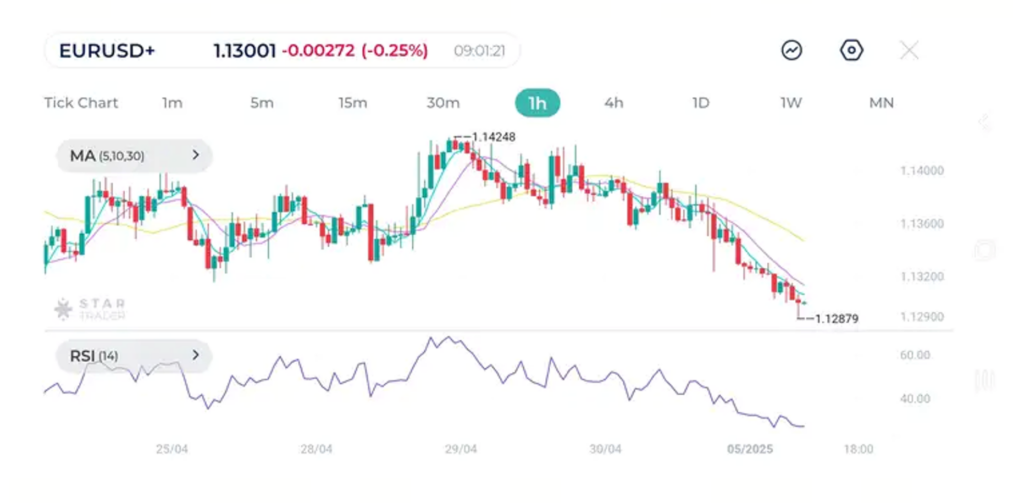
| Resistance | 1.1325 | 1.1350 | 1.1364 |
| Support | 1.1288 | 1.1250 | 1.1220 |
GBPUSD shows a clear downtrend after failing to hold above 1.3444 high. Price is continuously declining below all moving averages. The pair is trading near the zone 1.3270–1.3280 . The next support zone to watch out for is 1.3245–1.3250. Price showed strong selling pressure near levels 1.3330–1.3350, aligning with the moving average (10) and moving average (30)
RSI is approaching the oversold zone, currently hovering below 35. This indicates bearish momentum is still strong, but RSI flattening slightly suggests potential slowdown. The overall bias now is still bearish. A short-term pullback upwards suggest a potential drop afterwards. The trend remains down unless prices close above 1.3350.
GBPUSD 1H Chart
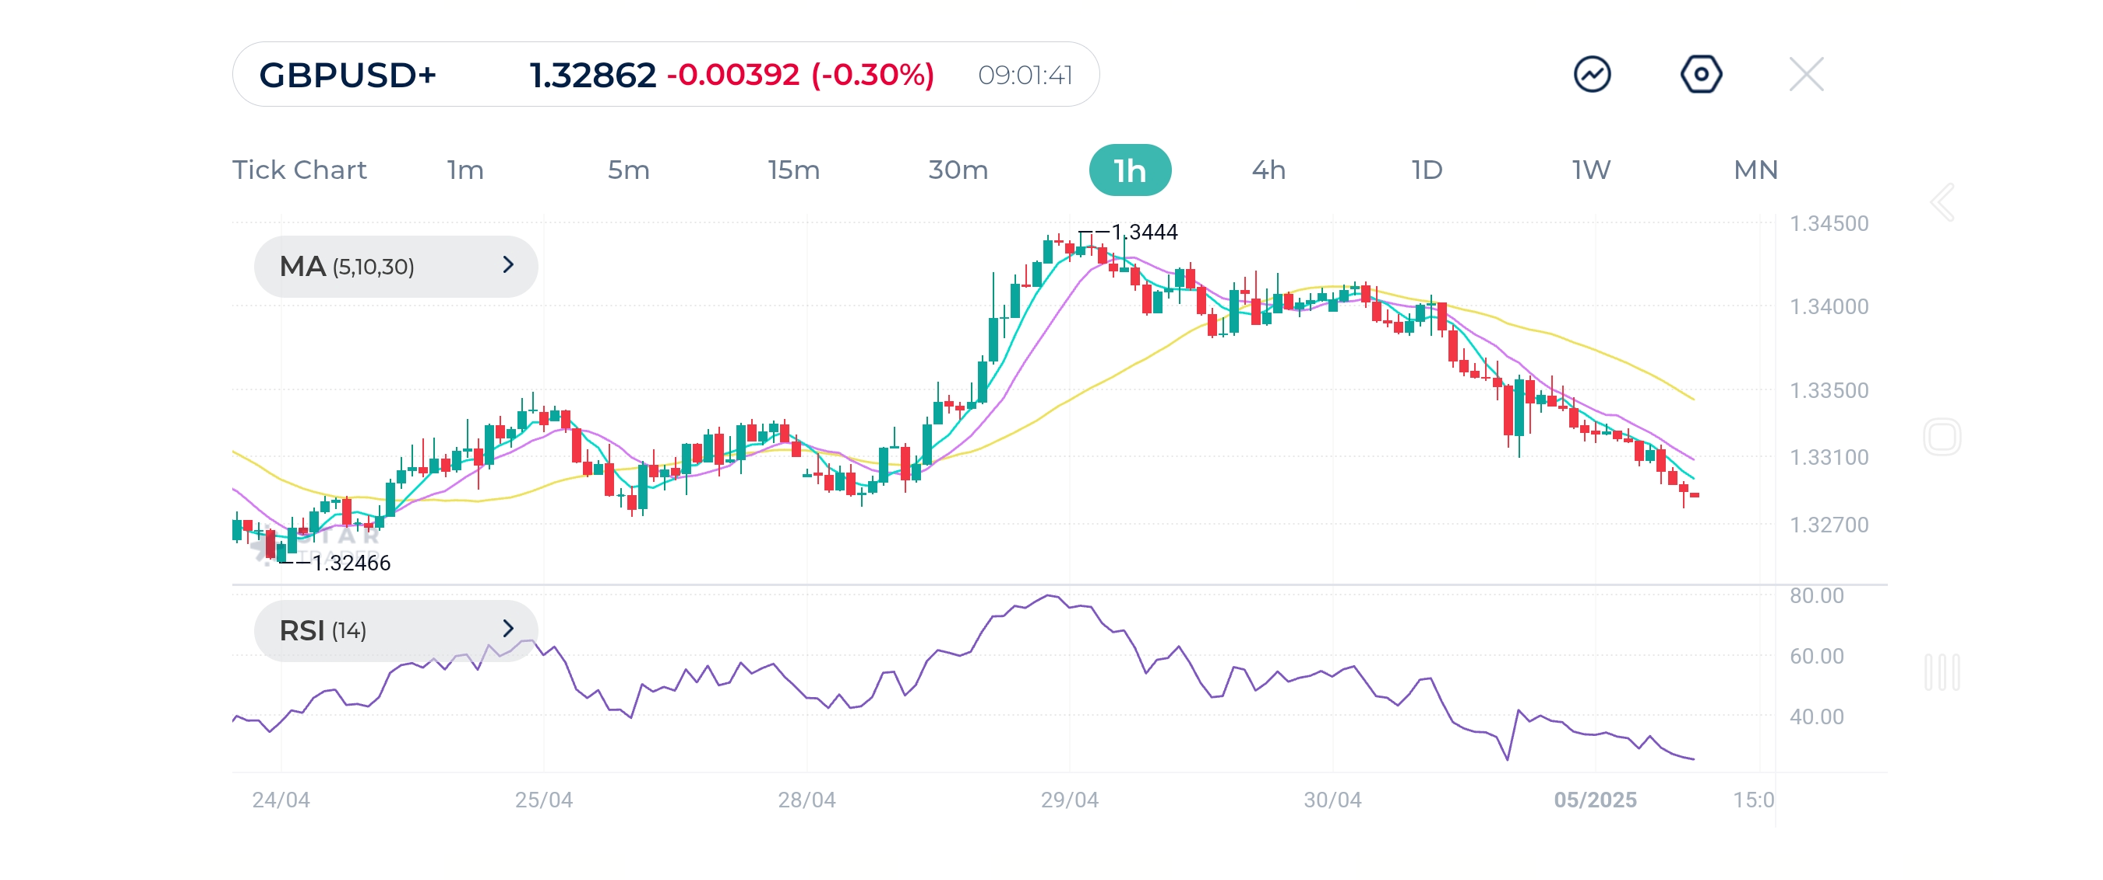
| Resistance | 1.3355 | 1.3382 | 1.3400 |
| Support | 1.3260 | 1.3245 | 1.3212 |
